CHANGING PLACES
  • Urbanisation
    • Extended Response - Urbanisation
  • Settlement patterns
  • Migration
    • Causes of internal migration
    • International Migration
    • Australia's cultural diversity
  • Australia’s Urban Future
    • Australia's Population Growth >
      • Graphs and Stats: Population Growth
      • Visual Representations: Population
      • Visual Representations: Population Density
      • Graphs and Stats: Population pyramids
    • Future Growth and Sustainability >
      • What is sustainability?
      • Sydenham to Bankstown
      • Geographical Inquiry - Urban Change in the Inner West
      • Spatial Technologies - GIS
      • Fieldwork: Marrickville
    • Sustainable Urban Places >
      • Light Rail and Metroline
      • GreenWay
      • Fieldwork: Greenway
      • WestConnex
      • Maps: WestConnex
      • Visual Representations: WestConnex infographic
      • Deindustrialisation
      • Visual Representations: Land use change in Marrickville
      • Extended response - Sustainable Urban Places
    • Contributing to a Sustainable Urban Future >
      • Community Contributions to Sustainability
      • Protests and RAGs
      • Fieldwork: WestConnex community percpetions
      • Geographical Inquiry
  • HSIE Teachers Home

Graphs and Stats: Population pyramids

Population pyramids show the age and gender structure of a population. They can be used to predict what will happen in the future and predict what services may be needed.
 
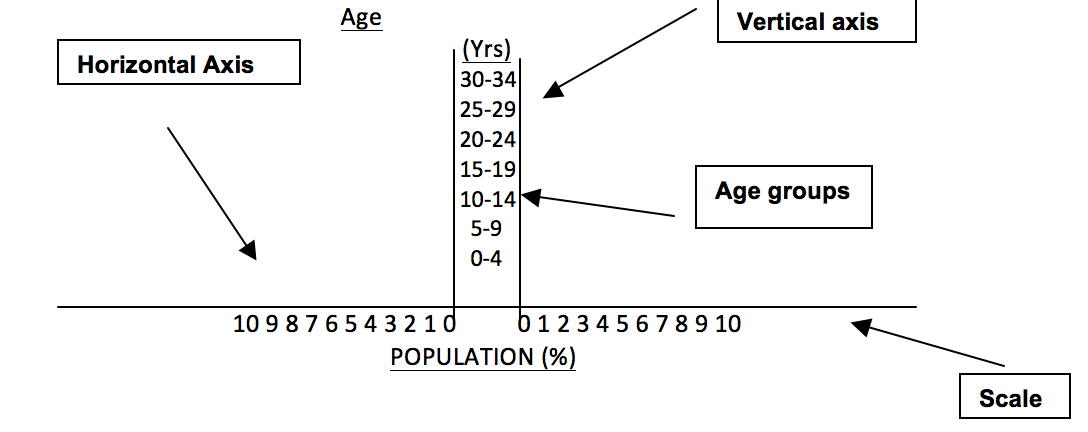
How to draw a population pyramid:
1. Draw a horizontal axis and add the scale. Remember to start in the middle with your scale and represent the males on
the left and the females on the right.


Picture
2. Draw two lines in the centre of the graph as your vertical axis. Label the age groups starting with 0-4 years and then increasing in 5 year age groups up the graph.

3. Using the data plot the bars with data for males on the left and data for females on the right. Don’t forget to label your graph!
Picture
Click to examine Australia's population pyramid.

L. Swanson, Hsieteachers.com 
  • Urbanisation
    • Extended Response - Urbanisation
  • Settlement patterns
  • Migration
    • Causes of internal migration
    • International Migration
    • Australia's cultural diversity
  • Australia’s Urban Future
    • Australia's Population Growth >
      • Graphs and Stats: Population Growth
      • Visual Representations: Population
      • Visual Representations: Population Density
      • Graphs and Stats: Population pyramids
    • Future Growth and Sustainability >
      • What is sustainability?
      • Sydenham to Bankstown
      • Geographical Inquiry - Urban Change in the Inner West
      • Spatial Technologies - GIS
      • Fieldwork: Marrickville
    • Sustainable Urban Places >
      • Light Rail and Metroline
      • GreenWay
      • Fieldwork: Greenway
      • WestConnex
      • Maps: WestConnex
      • Visual Representations: WestConnex infographic
      • Deindustrialisation
      • Visual Representations: Land use change in Marrickville
      • Extended response - Sustainable Urban Places
    • Contributing to a Sustainable Urban Future >
      • Community Contributions to Sustainability
      • Protests and RAGs
      • Fieldwork: WestConnex community percpetions
      • Geographical Inquiry
  • HSIE Teachers Home